
There is an app for everything — including roughly four thousand budgeting apps, each promising to fix your money in exchange for your bank login and a monthly subscription. Here is the unfashionable truth: you can build a budget tracker that works better than most of them in about 15 minutes, in a free Google Sheets spreadsheet — and you will understand every number in it, because you built it.
A do-it-yourself tracker has three advantages no app can copy. It is free — Google Sheets costs nothing and handles CAD just as happily as USD. It is private — no bank credentials handed to a startup. And it is yours — every column exists because you decided it should, so you actually learn what your numbers mean instead of letting an algorithm guess.
This guide walks you through the whole build in five steps: six columns, three buckets, one auto-split row, a five-minute weekly ritual, and the single number that tells you how you are doing. Note: there is no download or template file here — building it yourself is the feature, not a missing feature. Open a blank spreadsheet and let’s begin.
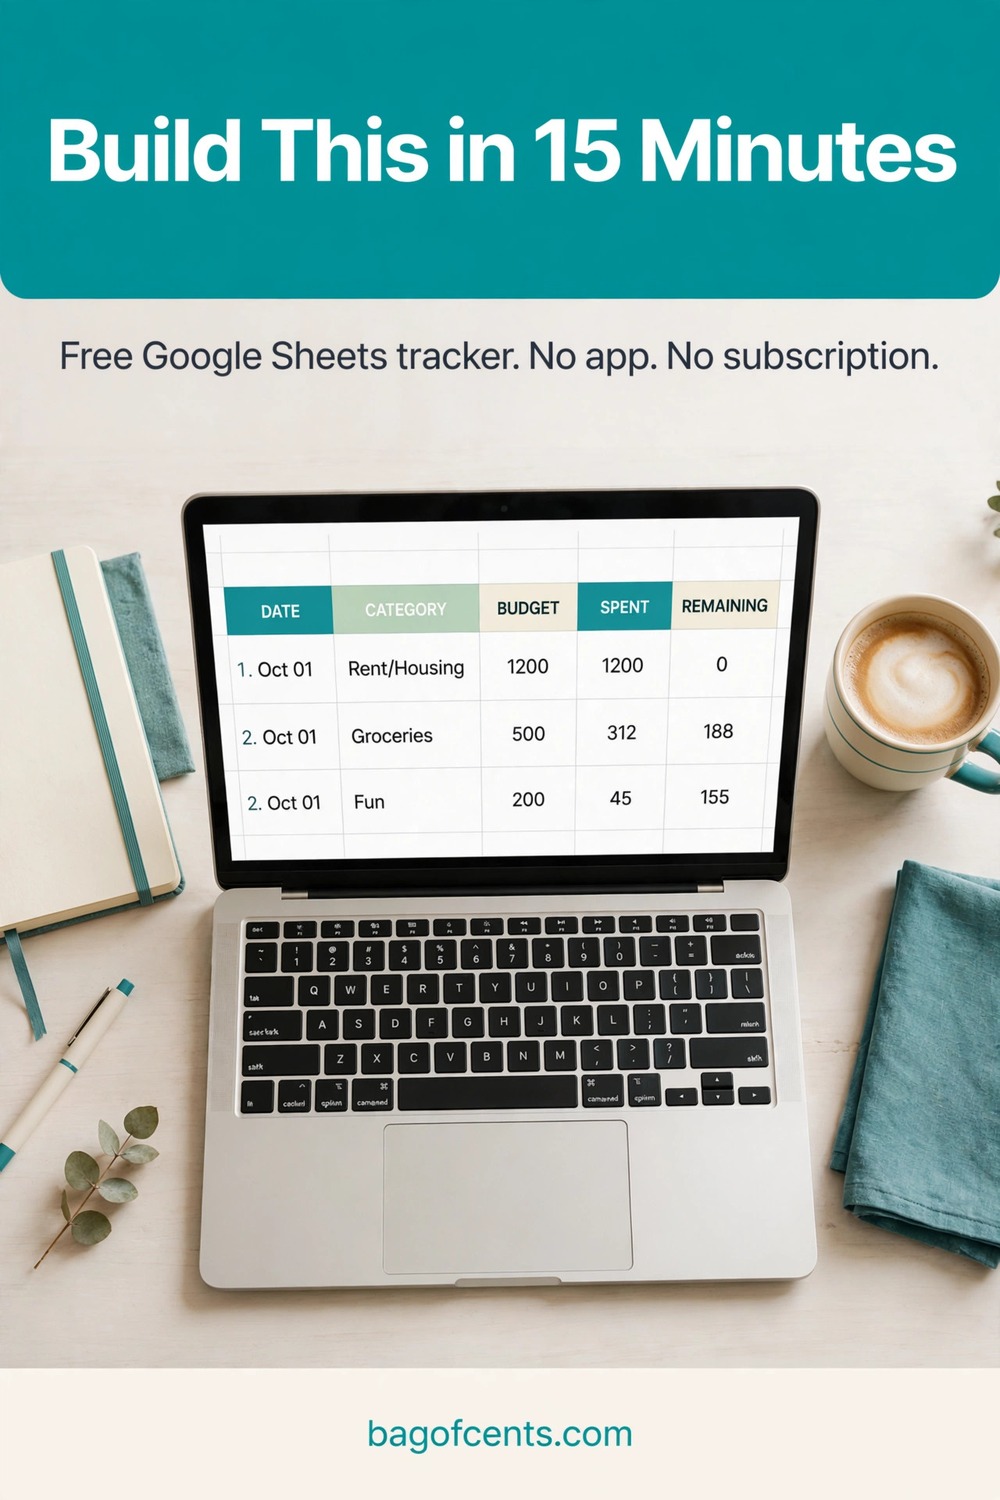
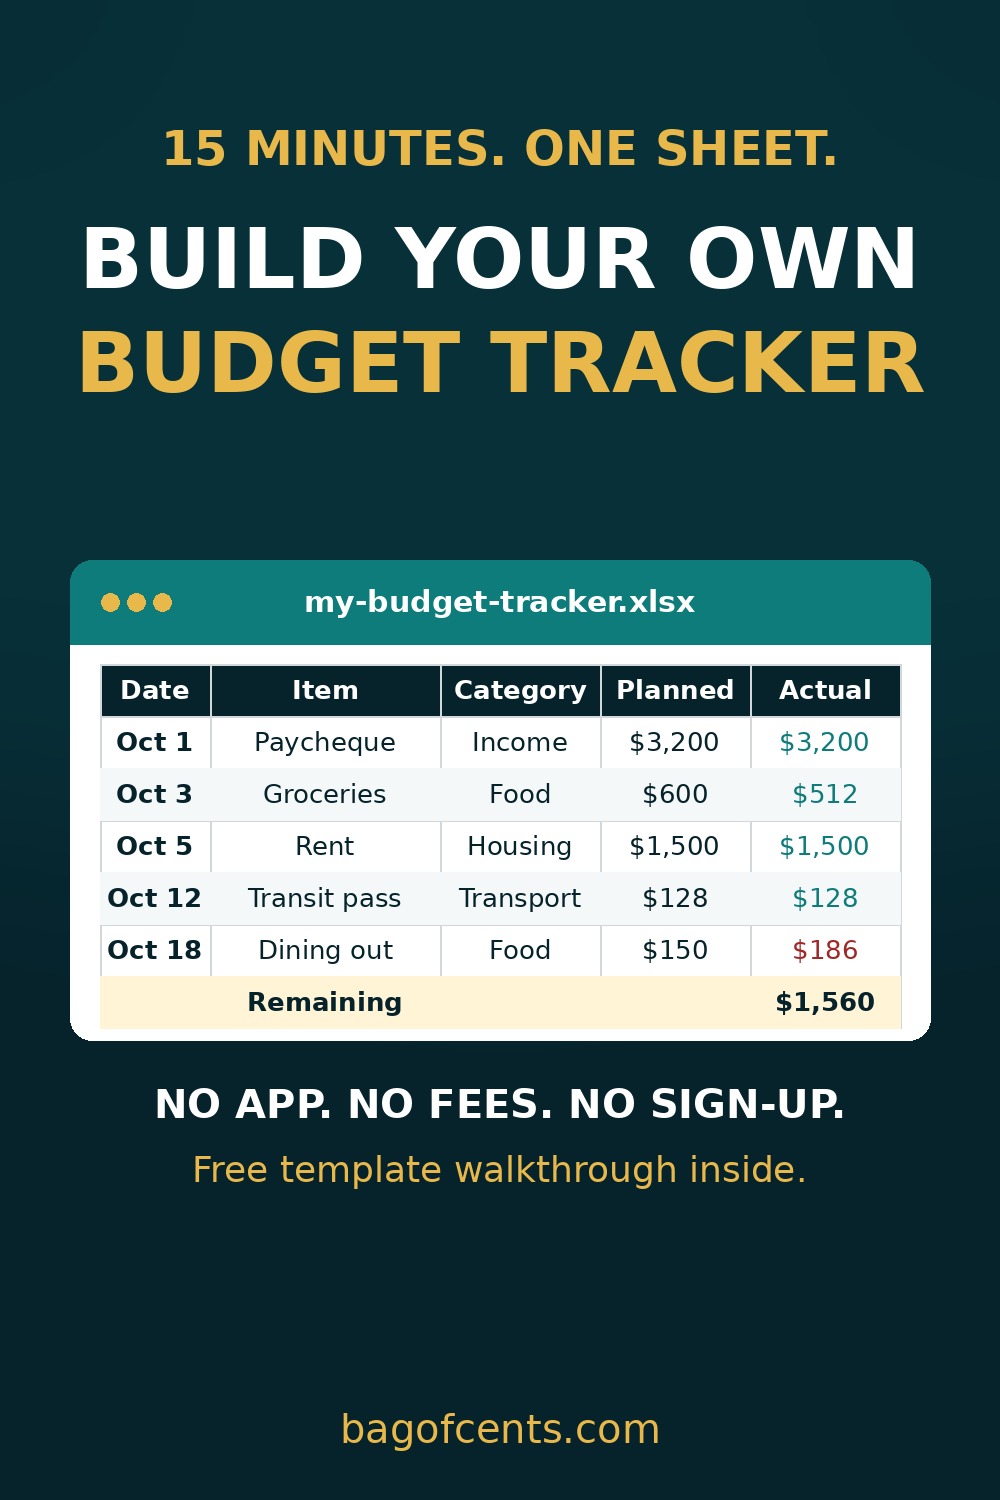
Try it live: use our free interactive Budget Tracker — enter your numbers and see your 50/30/20 split instantly. Open the Free Budget Tracker →
Why Build Your Own Tracker Instead of Downloading an App
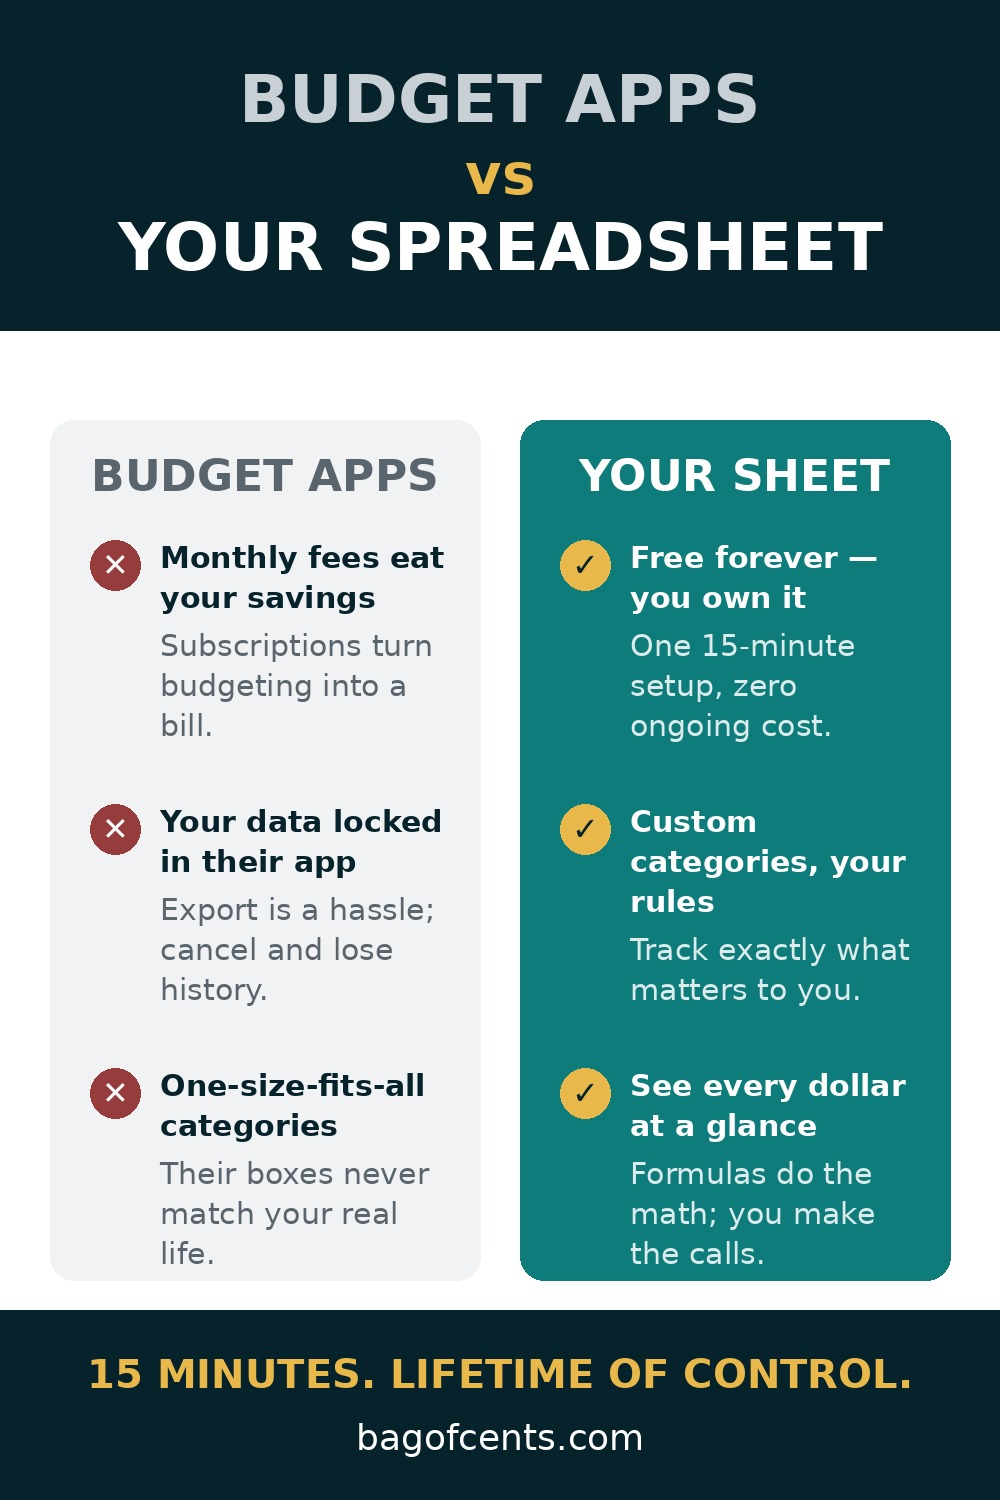
Budgeting apps are convenient, but convenience has costs. The subscription fee quietly eats the money you are trying to save. Bank-syncing means handing your credentials to a third party. And auto-categorization — the headline feature — routinely files things wrong, which means you stop trusting the numbers and stop opening the app. If you have ever downloaded a budgeting app, used it enthusiastically for a week, and abandoned it, the problem usually was not you. It was a tool doing the thinking for you.
A spreadsheet you built yourself flips that dynamic. Typing in your own spending forces you to see it — and seeing it is where behavior change starts. You decide the categories, so they match your real life instead of a developer’s guess. And the whole thing takes fifteen minutes to build and about five minutes a week to run, which is less time than you probably spend scrolling finance tips about budgeting.
If the app route has not stuck for you, the manual route is worth trying — the best tracking system is the one you will actually open.
Step 1: Set Up the 6 Columns That Run the Whole Tracker
Open a blank Google Sheet (everything here works identically in Excel) and label row 1, columns A through F. These six columns are the entire data model — resist the urge to add more:
- Date — when the money moved. “Oct 11” is fine; you do not need timestamps.
- Item — what it was, in your own words. “Groceries – Loblaws,” “Gas,” “Netflix.” Keep it short.
- Category — which of your three buckets it belongs to (more on buckets in step 2): Fixed, Variable, or Sinking.
- Planned — what you budgeted for this type of spending this month. Groceries might be $520 every time it appears.
- Actual — what you really spent. This is the truth column.
- Difference — planned minus actual, calculated automatically. In cell F2, type
=D2-E2and drag it down the column. Positive means under budget; negative means over.
That is it: one row per purchase, six columns, one tiny formula. Adding columns — store, payment method, notes — is how trackers die; six columns is a system you can maintain, sixteen is a second job.
Pro tip: freeze row 1 (View → Freeze → 1 row) so your headers stay visible while you scroll, and give the Difference column a quick conditional format — green for positive, red for negative — so problems announce themselves visually.
Step 2: Sort Every Dollar Into 3 Buckets
Every expense belongs in exactly one of three buckets. Three is the magic number: enough to be useful, few enough to stay effortless.
Fixed — the bills that barely change month to month: rent or mortgage, phone, internet, insurance premiums, streaming subscriptions, minimum debt payments. These are your non-negotiables; they get funded first.
Variable — the spending that flexes: groceries, gas, dining out, clothing, personal care, household odds and ends. This bucket is where most budgets are won or lost, because it is the one you control day to day.
Sinking — big, irregular, but predictable expenses: car repairs, holiday gifts, annual subscriptions, home maintenance, winter tires (a very Canadian line item). Sinking funds get their own bucket because they are the ambush expenses that wreck otherwise good months. Setting aside a little each month turns a $900 surprise into a planned event.
When you are unsure where something goes, ask: “Does this happen every month for about the same amount?” Fixed. “Does it change based on my choices?” Variable. “Does it hit once or twice a year and hurt?” Sinking. You will get faster at this within two weeks.
Step 3: Add the 50/30/20 Auto-Split Row
Now give the tracker a brain. At the top of the sheet (rows 1–4 work well, above your transaction headers) or in a summary block at the bottom, set up three target rows based on the 50/30/20 rule: 50% of take-home pay for needs, 30% for wants, 20% for savings and future goals.
You only need three simple formulas, described here in plain words so you can build them even if you have never touched a spreadsheet formula:
- Bucket totals: “Add up the Actual column, but only for rows marked Fixed.” In Sheets or Excel, that is
=SUMIF(C:C,"Fixed",E:E)— it scans your Category column and sums the matching Actual amounts. Make one for each bucket. - Your three targets: take-home pay times 0.5, 0.3, and 0.2. On $4,200 a month, that is $2,100 for needs, $1,260 for wants, and $840 for savings. Type these as plain numbers or as formulas like
=4200*0.5. - The check: target minus bucket total for each row. Positive means you are inside the line; negative means that bucket needs attention.
Map your buckets to the rule loosely: Fixed to needs, Variable to wants, Sinking plus savings to the 20%. If your city’s rents make 50% needs impossible, adjust the split (60/25/15 is a common adaptation) and protect the savings slice above all.
Step 4: The Weekly 5-Minute Review Ritual
A spreadsheet you never open is decoration. The tracker only works if you look at it — which is why step 4 is a ritual, not a feature. Pick a recurring time, Sunday evening works well for most people, and run this four-move loop:
- Enter the week’s spending — pull up your banking app and type in each transaction. Five minutes, tops, once you are in the habit.
- Scan the Difference column — the red cells tell you exactly where the month is leaking. No judgment, just information.
- Rebalance once if needed — overspent on dining out? Pull the difference from entertainment or clothing. Moving money between categories is not failure; it is the skill the tracker is teaching you.
- Confirm your savings transfer happened — the 20% should move automatically the day after payday. If it did not, move it now, manually, before the money evaporates.
That is the whole ritual. The weekly check-in matters more than the monthly setup — budgets rarely fail on day one; they fail quietly on day nineteen, when nobody is watching.
Step 5: Watch the One Number That Matters
After a month of entries, your sheet holds dozens of numbers. Ignore most of them. The one number that matters is the total of your Difference column — a single =SUM(F:F) at the bottom.
If that total is positive, you spent less than you planned overall. If it is negative, you overspent — and the red cells above it show you exactly where. This single number replaces the vague anxiety of checking your bank balance and hoping. It turns “I think I’m doing okay” into “I am $214 under plan with nine days left.”
Give that number a job: at month-end, sweep any positive difference into savings — emergency fund, TFSA, or debt payoff. Negative months are not failures; they are data. Two negative months in groceries means your Planned number was fantasy — adjust the plan, not your self-worth.
Walkthrough: $4,200 a Month in the Tracker
Walk a fictional household’s $4,200 take-home pay through the finished tracker — $2,100 needs, $1,260 wants, $840 savings and sinking funds:
Fixed bucket — $2,100 planned: rent $1,400 · utilities $170 · phone $65 · internet $70 · tenant insurance $145 · transit pass $110 · minimum debt payments $140. Total: exactly $2,100.
Variable bucket — $1,260 planned: groceries $520 · dining out $180 · gas $120 · clothing and personal care $140 · entertainment $120 · miscellaneous $180. Total: $1,260.
Sinking + savings — $840 planned: car repairs $80 · gifts and holidays $70 · annual subscriptions $50 · emergency fund $340 · TFSA contribution $300. Total: $840.
Watch the Difference column earn its keep: groceries come in at $561 vs. $520 planned (–$41, red), dining out at $143 vs. $180 (+$37, green). One glance tells the story — no guilt spiral, no mystery, just the numbers and a decision for next week.
Notice what the tracker did not require: no bank login, no subscription, no forty categories, no app update. Fifteen minutes to build, five minutes a week to run, and a household that finally knows where its $4,200 goes.
5 Budget Spreadsheet Mistakes to Avoid
Mistake 1: Tracking every penny in forty categories. “Coffee – home” vs. “Coffee – shop” vs. “Coffee – work” is how trackers die. Fewer, broader categories survive; forensic detail does not. If a category gets fewer than a few entries a month, merge it.
Mistake 2: Skipping the weekly review. Entering transactions without reviewing them is data entry, not budgeting. Without the Sunday check-in, you have a spreadsheet-shaped diary.
Mistake 3: Confusing savings with leftovers. “I’ll save whatever is left at month-end” means saving nothing, because there is never anything left. Savings is a Planned line with its own amount, moved on payday — not a hope assigned to the Difference column’s mercy.
Mistake 4: Budgeting fantasy numbers. If you always spend $650 on groceries, planning $400 does not make you disciplined — it makes the tracker a fiction you stop believing by week two. Budget real numbers first, then trim them as a separate project.
Mistake 5: Forgetting the sinking funds. If an expense is predictable but irregular, it needs a monthly sinking line — otherwise Christmas, car repairs, and annual fees will keep ambushing your budget.
Budget Tracker Spreadsheet FAQs
Google Sheets or Excel — does it matter? Not for this build. Sheets is free, autosaves, and works on your phone; Excel works offline and most people already have it. Every formula here (SUM, SUMIF, simple subtraction) exists in both. Pick whichever you will actually open.
Do I need to know formulas already? No. You need exactly three: =D2-E2 for the Difference column, =SUM(F:F) for the one number that matters, and =SUMIF(C:C,"Fixed",E:E) for bucket totals. Copy them from this article, adjust the column letters if yours differ, and you are done.
What if my income is irregular? Build the tracker on your lowest typical month. In better months, sweep the positive Difference to savings instead of letting lifestyle absorb it.
Can I maintain this on my phone? Yes — the build is easier on a laptop, but weekly entry works fine in the Sheets app. If phone entry feels like friction, jot transactions in a notes app and batch-enter on Sunday.
How is this different from just following the 50/30/20 rule? The rule is the strategy; the tracker is the instrument panel. 50/30/20 tells you where money should go, and the spreadsheet shows where it actually went, every week. They are a strong pair — which is why step 3 wires the rule directly into the sheet.
Final Thought
A budget tracker will not give you more money. It ends the monthly mystery of “where did it all go?” — every dollar gets a column, every column gets a Sunday glance, and the Difference total tells the truth in one number.
Fifteen minutes today: six columns, three buckets, three formulas. Five minutes every Sunday after that. A year from now, you will not remember the afternoon you built it — but your savings account will show the compound interest of fifty-two small, honest check-ins. Open the blank sheet. Label row one. Start.
Liked this? Take it further.
Grab our free 52-Week Savings Challenge Tracker and save up to $1,378 in a year — one small weekly deposit at a time, with a printable tracker to keep you on course.
Join the Bagofcents weekly money tips email. Unsubscribe anytime.
Happy Budgeting!
Stanley
Leave a Reply